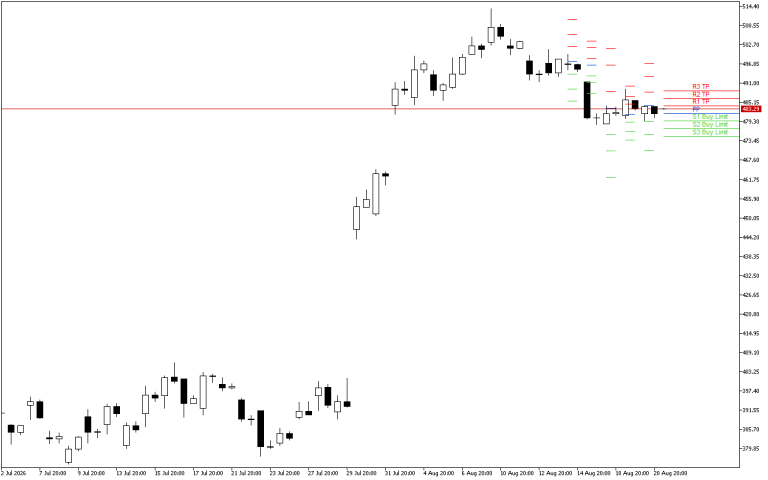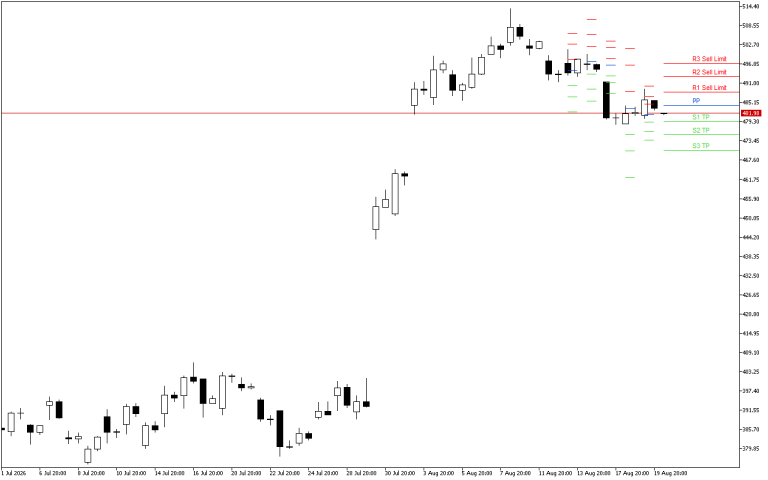
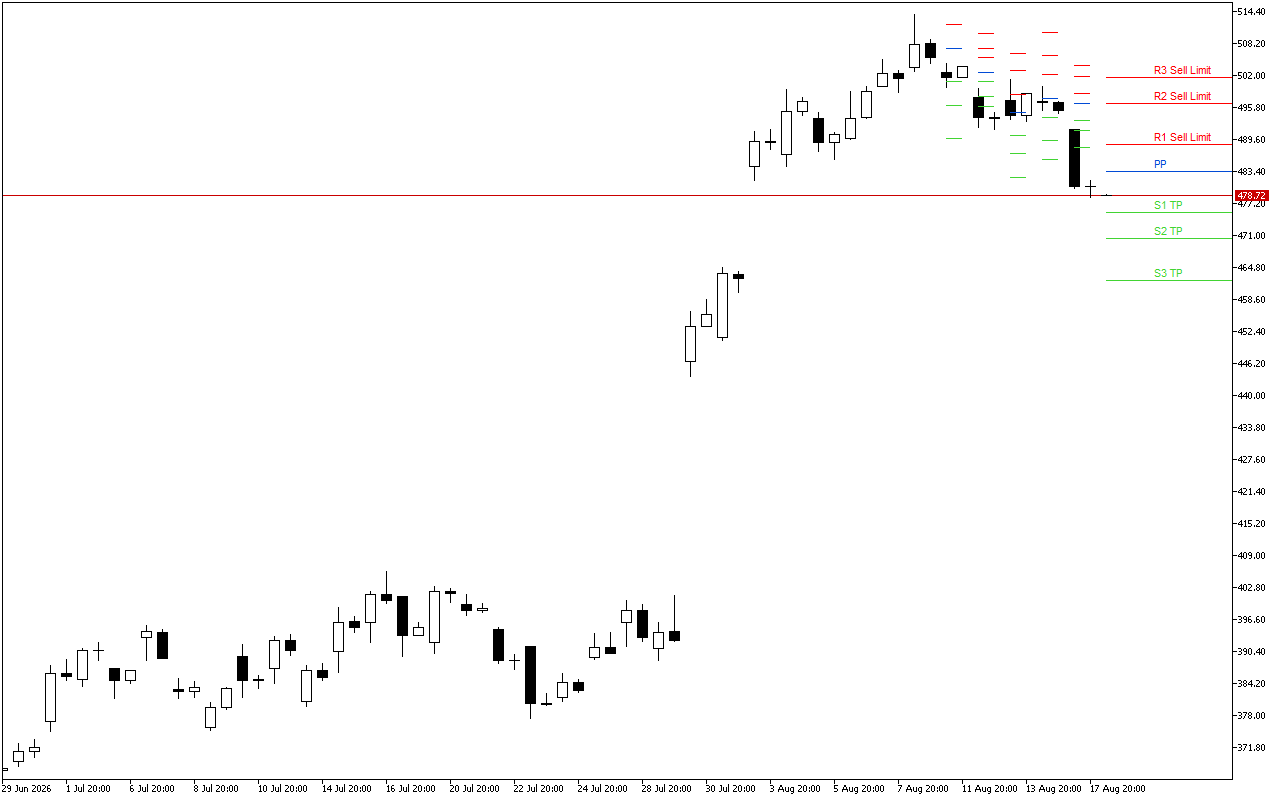
The Pivot Points levels for Microsoft for the U.S. session:
PP: 483.46;S1: 475.41; S2: 470.37; S3: 462.32;R1: 488.50; R2: 496.55; R3: 501.59.
The chart generated the value Pivot Points in the area 483.46. Since the market opened below this level, it indicates a prevailing pessimistic mood. In this case, intraday the trader should tend to look for entry points into short positions.
Trading recommendations:
The support levels, marked green on the chart, are at the S1 475.41, S2 470.37, and S3 462.32 levels.
The resistance levels are marked with red and are located at R1 488.50, R2 496.55 and R3 501.59.
The entry points should be considered at the PP level and when the price rolls back to the area of the resistance levels marked with red. The transaction closes when the price reaches the S1, S2, S3 levels.